Market Outlook
March 27, 2017
Market Cues
Domestic Indices
Chg (%)
(Pts)
(Close)
Indian markets are likely to open with negative bias tracking the SGX Nifty & Asian
BSE Sensex
0.3
89
29,421
markets.
Nifty
0.2
22
9,108
With traders keeping a close eye on developments on Capitol Hill, US markets saw
Mid Cap
(0.0)
(4)
13,849
some volatility over the course of the trading session on Friday. The major averages
Small Cap
0.4
50
14,078
eventually ended the day on opposites sides of the unchanged line. The volatility on
Bankex
1.2
292
24,061
Wall Street came as the House prepared to vote on a Republican bill to repeal and
replace Obamacare.
Global Indices
Chg (%)
(Pts)
(Close)
The majority of the European markets ended Friday's session with small losses. The
markets were locked in a narrow sideways trend throughout the session. Investors
Dow Jones
(0.3)
(60)
20,597
were reluctant to make any major moves ahead of a crucial vote on U.S. healthcare
Nasdaq
0.2
11
5,829
reform.
FTSE
(0.1)
(4)
7,337
Nikkei
0.9
177
19,263
Indian markets rose on Friday, although benchmark indexes ended off their day's
highs amid caution ahead of a key U.S. vote on healthcare plan due tonight
Hang Seng
0.1
31
24,358
intended to repeal and replace the Affordable Care Act.
Shanghai Com
0.6
21
3,269
News Analysis
Advances / Declines
BSE
NSE
GVK completes `2,200Cr stake sale in Bangalore Airport project
Detailed analysis on Pg2
Advances
1,363
798
Declines
1,467
838
Investor’s Ready Reckoner
Unchanged
223
87
Key Domestic & Global Indicators
Stock Watch: Latest investment recommendations on 150+ stocks
Volumes (` Cr)
Refer Pg5 onwards
BSE
5,567
Top Picks
NSE
23,383
CMP
Target
Upside
Company
Sector
Rating
(`)
(`)
(%)
Amara Raja Batteries Auto & Auto AncillaryAccumulate
877
1,009
15.0
Net Inflows (` Cr)
Net
Mtd
Ytd
HCL Tech
IT
Accumulate
871
1,000
14.8
FII
211
20,137
30,576
Power Grid Corp.
Power
Buy
194
223
15.1
MFs
(299)
(1,533)
5,537
Navkar Corp.
Others
Buy
173
265
53.1
KEI Industries
Others
Buy
175
207
18.3
Top Gainers
Price (`)
Chg (%)
More Top Picks on Pg3
Kec
209
9.4
Key Upcoming Events
Wabag
670
7.5
Previous
Consensus
Date
Region
Event Description
Reading
Expectations
Orientbank
144
6.5
Mar 28, 2017 US
Initial Jobless claims
258.00
--
Bankindia
133
5.0
Mar 30, 2017 US
Consumer Confidence
114.80
113.40
Recltd
174
4.4
Mar 30, 2017 Euro Zone Euro-Zone Consumer Confidence
-5.00
-5.00
Mar 30, 2017 China
PMI Manufacturing
51.60
51.70
Top Losers
Price (`)
Chg (%)
Mar 31, 2017 US
GDP Qoq (Annualised)
1.90
2.00
Mar 31, 2017 Germany Unemployment change (000's)
-15.00
-10.00
Jindalstel
120
(4.5)
More Events on Pg4
Sadbhav
309
(3.8)
Sreinfra
86
(2.8)
Nlcindia
110
(2.8)
Supremeind
1,039
(2.8)
As on March 24, 2017
Market Outlook
March 27, 2017
News Analysis
GVK completes `2,200Cr stake sale in Bangalore Airport project
GVK Power and Infrastructure on Friday announced that it has completed the stake
sale in Bangalore International Airport Project (BIAL).It has divested 33 per cent of
its stake in Bangalore Airport and Infrastructure Developers — wholly owned
subsidiary of BIAL — to Fairfax India Holdings Corporation, for an aggregate
amount of `2,202Cr ($336.18 million).
It may be recalled that the company had first announced the stake sale deal with
Fairfax in March 2016, while it took one full year to complete the process owing to
delay in foreign direct investment (FDI) clearances among other things. Post sale,
GVK group would have 10 per cent stake in this profit-making airport asset.
Economic and Political News
Kerala seeks `1,000Cr from Centre to face worst drought in 115 years
RBI allows exchange of `4,500 in old notes in Nepal
Bihar power shock: BERC increases electricity tariffs by 55%
Govt, RBI examined viability of introducing `5,000 and `10,000 notes
Corporate News
TCS ties up with LIBA to launch PGDM course on Business Analytics
Essar Steel urged to seek consent for developing iron ore block
CCI slaps `591Cr penalty on Coal India
Lower tariff constrains telecom operators' capacity to invest: Govt
Market Outlook
March 27, 2017
Top Picks ★★★★★
Large Cap
Market Cap
CMP
Target
Upside
Company
Rationale
(` Cr)
(`)
(`)
(%)
To outpace battery industry growth due to better technological
Amara Raja Batteries
14,988
877
1,009
15.0
products leading to market share gains in both the
automotive OEM and replacement segments.
Strong growth in domestic business due to its leadership in
Alkem Laboratories
26,351
2,204
2,257
2.4
acute therapeutic segment. Alkem expects to launch more
products in USA, which bodes for its international business.
The stock is trading at attractive valuations and is factoring all
HCL Tech
1,22,974
871
1,000
14.8
the bad news.
Back on the growth trend, expect a long term growth of 14%
Infosys
2,36,999
1,032
1,249
21.0
to be a US$20bn in FY2020.
Strong order backlog and improvement in execution would
Larsen & Tourbo
1,44,736
1,551
1,700
9.6
trigger the growth for the L&T.
One of the largest pharma companies with strong
Lupin
66,984
1,484
1,809
21.9
international presence. It has a rich pipeline of ANDAs which
is also one of the largest among the generic companies.
Going forward, we expect the company to report strong top-
Power Grid Corporation
1,01,336
194
223
15.1
line CAGR of ~16% and bottom-line CAGR of ~19% over
FY16-18 on back of strong capitalization guidance
Source: Company, AngelResearch
Mid Cap
Market Cap
CMP
Target
Upside
Company
Rationale
(` Cr)
(`)
(`)
(%)
Among the top 4 players in the consumer durables segment.
Bajaj Electricals
3,198
316
330
4.5
Improved profitability backed by turn around in E&P segment.
Strong order book lends earnings visibility.
Favourable outlook for the AC industry to augur well for
Cooling products business which is out pacing the market
Blue Star
5,831
610
634
3.9
growth. EMPPAC division's profitability to improve once
operating environment turns around.
Strong loan growth backed by diversified loan portfolio and
Equitas Holdings
5,346
158
235
48.4
adequate CAR. ROE & ROA likely to remain decent as risk of
dilution remains low. Attractive valuations considering growth.
Economic recovery to have favourable impact on advertising
& circulation revenue growth. Further, the acquisition of a
Jagran Prakashan
5,714
175
225
28.7
radio business (Radio City) would also boost the company's
revenue growth.
High order book execution in EPC segment, rising B2C sales
KEI Industries
1,361
175
207
18.3
and higher exports to boost the revenues and profitability
Speedier execution and speedier sales, strong revenue visibilty
Mahindra Lifespace
1,681
410
522
27.5
in short-to-long run, attractive valuations
Higher growth in domestic branded sales and healthy export
Mirza International
1,012
84
107
27.2
to boost the profitability.
Massive capacity expansion along with rail advantage at ICD
Navkar Corporation
2,469
173
265
53.1
as well CFS augurs well for the company
Strong brands and distribution network would boost growth
Siyaram Silk Mills
1,576
1,681
1,872
11.4
going ahead. Stock currently trades at an inexpensive
valuation.
Market leadership in Hindi news genre and no. 2 viewership
ranking in English news genre, exit from the radio business,
TV Today Network
1,604
269
344
27.9
and anticipated growth in ad spends by corporates to benefit
the stock.
Source: Company, Angel Research
Market Outlook
March 27, 2017
Key Upcoming Events
Global economic events release calendar
Date
Time
Country
Event Description
Unit
Period
Bloomberg Data
Last Reported Estimated
Mar 28, 2017 6:00PM
US
Initial Jobless claims
Thousands
Mar 25
258.00
--
Mar 30, 2017 7:30PM
US
Consumer Confidence
S.A./ 1985=100
Mar
114.80
113.40
2:30PM
Euro Zone
Euro-Zone Consumer Confidence
Value
Mar F
(5.00)
(5.00)
6:30AM
China
PMI Manufacturing
Value
Mar
51.60
51.70
Mar 31, 2017 6:00PM
US
GDP Qoq (Annualised)
% Change
4Q T
1.90
2.00
1:25PM
Germany
Unemployment change (000's)
Thousands
Mar
(15.00)
(10.00)
2:00PM
UK
GDP (YoY)
% Change
4Q F
2.00
2.00
Apr 3, 2017
2:00PM
UK
PMI Manufacturing
Value
Mar
54.60
--
Apr 6, 2017
2:30PM
India
RBI Reverse Repo rate
%
Apr 6
5.75
--
2:30PM
India
RBI Repo rate
%
Apr 6
6.25
--
2:30PM
India
RBI Cash Reserve ratio
%
Apr 6
4.00
--
Apr 7, 2017
2:00PM
UK
Industrial Production (YoY)
% Change
Feb
3.20
--
6:00PM
US
Change in Nonfarm payrolls
Thousands
Mar
235.00
163.00
6:00PM
US
Unnemployment rate
%
Mar
4.70
4.70
Apr 10, 2017
India
Imports YoY%
% Change
Mar
21.76
--
2:00PM
UK
CPI (YoY)
% Change
Mar
2.30
--
Apr 11, 2017
India
Exports YoY%
% Change
Mar
17.48
--
Apr 12, 2017
2:00PM
UK
Jobless claims change
% Change
Mar
(11.30)
--
5:30PM
India
Industrial Production YoY
% Change
Feb
2.70
--
7:00AM
China
Consumer Price Index (YoY)
% Change
Mar
0.80
--
Apr 13, 2017
US
Producer Price Index (mom)
% Change
Mar
0.10
--
China
Exports YoY%
% Change
Mar
(1.30)
--
Apr 14, 2017
6:00PM
US
Consumer price index (mom)
% Change
Mar
0.10
(0.10)
Apr 17, 2017
12:00PM
India
Monthly Wholesale Prices YoY%
% Change
Mar
6.55
--
7:30AM
China
Industrial Production (YoY)
% Change
Mar
6.00
--
6:00PM
US
Housing Starts
Thousands
Mar
1,288.00
--
Apr 18, 2017
6:00PM
US
Building permits
Thousands
Mar
1,213.00
--
6:45PM
US
Industrial Production
%
Mar
0.01
--
7:30AM
China
Real GDP (YoY)
% Change
1Q
6.80
--
Source: Bloomberg, Angel Research
Market Outlook
March 27, 2017
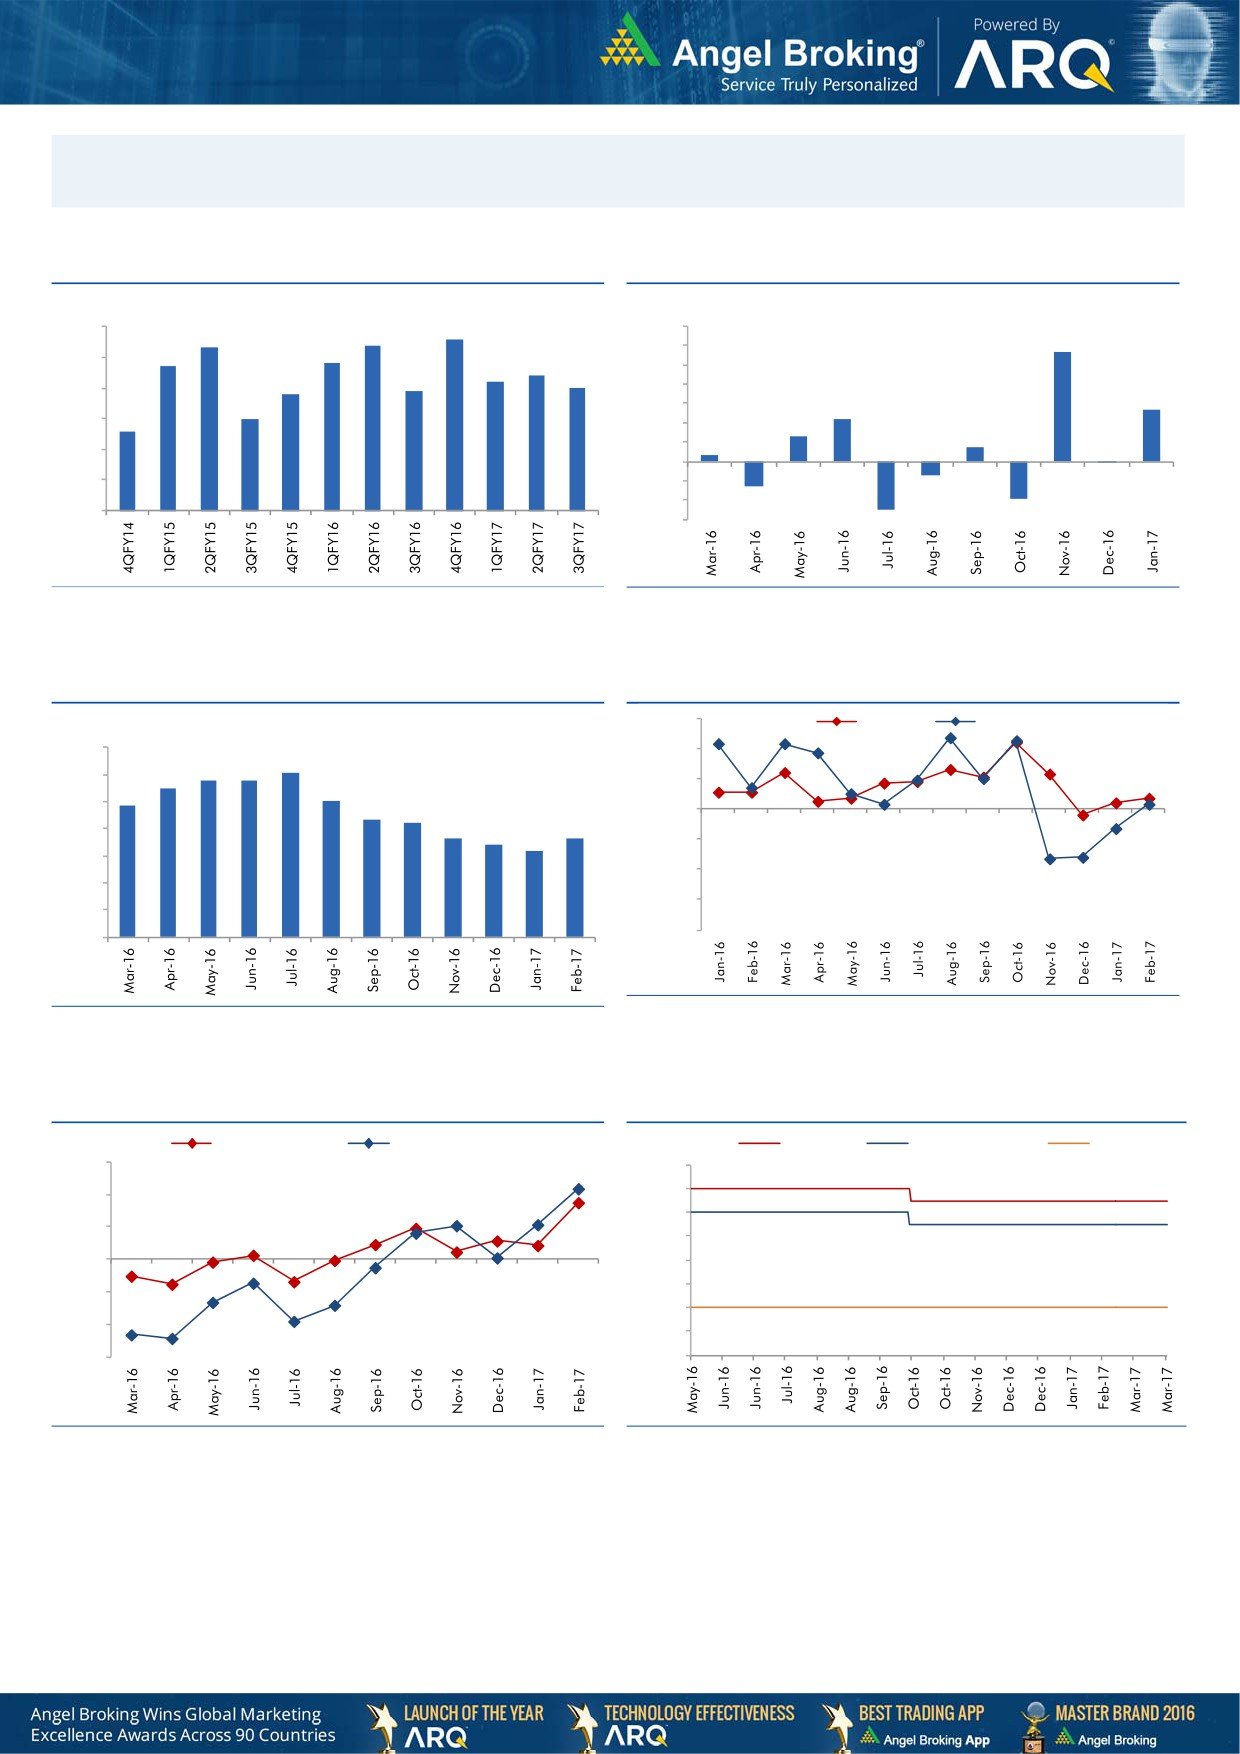
Macro watch
Exhibit 1: Quarterly GDP trends
Exhibit 2: IIP trends
(%)
(%)
8.6
9.0
8.4
7.0
8.3
5.7
7.7
7.8
6.0
8.0
7.4
7.2
5.0
6.9
7.0
6.8
7.0
4.0
2.7
6.0
3.0
2.2
6.0
5.6
1.3
2.0
0.7
1.0
0.3
5.0
-
4.0
(1.0)
(0.1)
(0.7)
(2.0)
3.0
(1.3)
(3.0)
(1.9)
(2.5)
Source: CSO, Angel Research
Source: MOSPI, Angel Research
Exhibit 3: Monthly CPI inflation trends
Exhibit 4: Manufacturing and services PMI
56.0
Mfg. PMI
Services PMI
(%)
7.0
54.0
6.1
5.8
5.8
6.0
5.5
5.1
52.0
4.8
5.0
4.3
4.2
50.0
3.6
3.7
4.0
3.4
3.2
48.0
3.0
46.0
2.0
44.0
1.0
42.0
-
Source: Market, Angel Research; Note: Level above 50 indicates expansion
Source: MOSPI, Angel Research
Exhibit 5: Exports and imports growth trends
Exhibit 6: Key policy rates
(%)
Exports yoy growth
Imports yoy growth
(%)
Repo rate
Reverse Repo rate
CRR
30.0
7.00
20.0
6.50
6.00
10.0
5.50
0.0
5.00
4.50
(10.0)
4.00
(20.0)
3.50
(30.0)
3.00
Source: Bloomberg, Angel Research
Source: RBI, Angel Research
Market Outlook
March 27, 2017
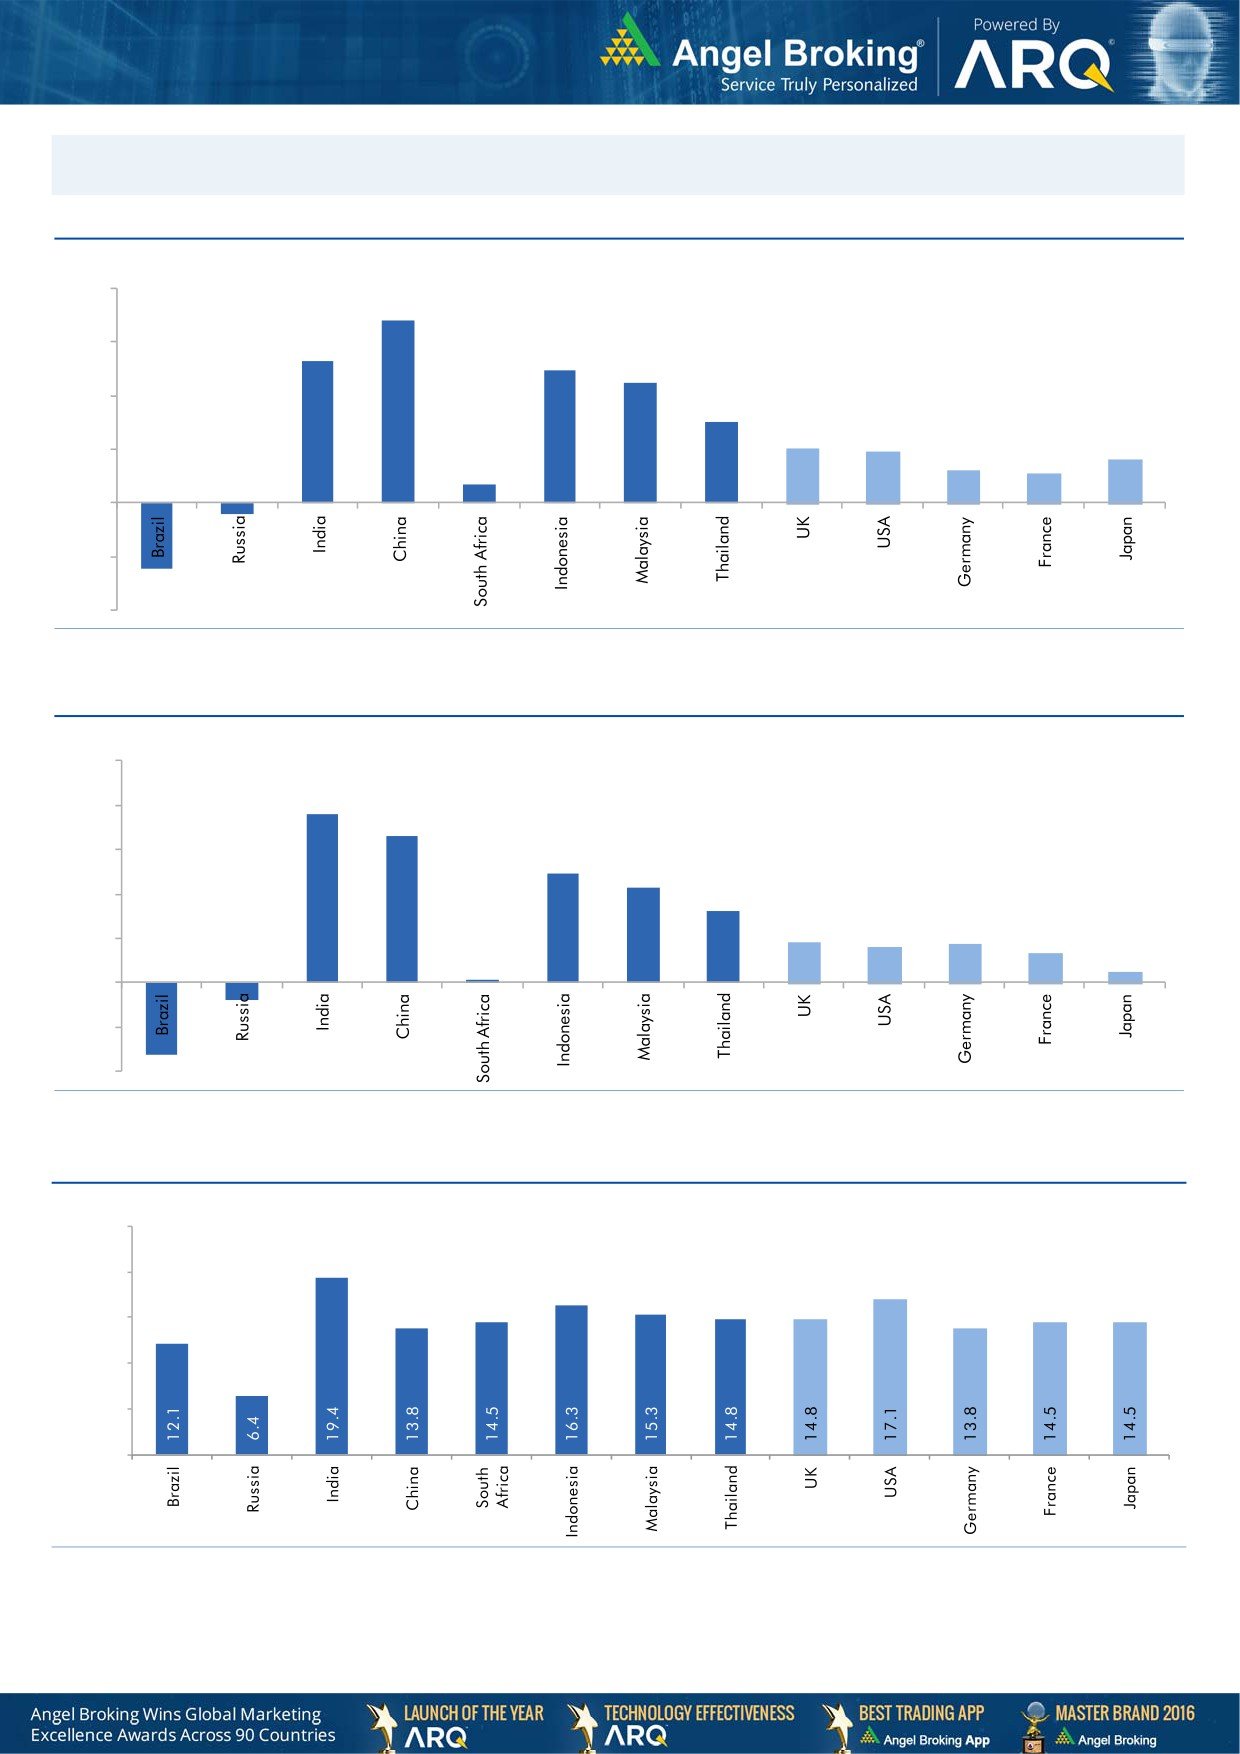
Global watch
Exhibit 1: Latest quarterly GDP Growth (%, yoy) across select developing and developed countries
(%)
8.0
6.8
6.0
5.3
4.9
0.7
4.5
4.0
3.0
2.0
1.9
2.0
1.2
1.6
1.1
-
(2.0)
(0.4)
(2.5)
(4.0)
Source: Bloomberg, Angel Research
Exhibit 2: 2016 GDP Growth projection by IMF (%, yoy) across select developing and developed countries
(%)
10.0
7.6
8.0
6.6
6.0
4.9
4.3
4.0
3.2
1.8
1.7
1.6
2.0
1.3
(0.8)
0.5
(3.3)
0.1
-
(2.0)
(4.0)
Source: IMF, Angel Research
Exhibit 3: One year forward P-E ratio across select developing and developed countries
(x)
25.0
20.0
15.0
10.0
5.0
-
Source: IMF, Angel Research
Market Outlook
March 27, 2017
Exhibit 4: Relative performance of indices across globe
Returns (%)
Country
Name of index
Closing price
1M
3M
1YR
Brazil
Bovespa
63,854
(6.3)
8.8
24.1
Russia
Micex
2,040
(3.8)
(8.1)
9.7
India
Nifty
9,108
3.0
12.4
21.2
China
Shanghai Composite
3,269
(0.1)
4.2
13.6
South Africa
Top 40
44,663
(1.2)
3.7
(6.0)
Mexico
Mexbol
49,084
2.8
7.9
6.3
Indonesia
LQ45
926
4.5
7.9
8.5
Malaysia
KLCI
1,746
2.2
6.8
1.7
Thailand
SET 50
998
1.2
5.2
10.4
USA
Dow Jones
20,597
0.2
4.1
18.0
UK
FTSE
7,337
0.5
4.2
18.3
Japan
Nikkei
19,263
(0.6)
(0.7)
12.5
Germany
DAX
12,064
(0.1)
4.3
22.0
France
CAC
5,021
2.4
3.5
17.8
Source: Bloomberg, Angel Research
Stock Watch
March 27, 2017
Company Name
Reco
CMP
Target
Mkt Cap
Sales ( Čcr )
OPM(%)
EPS (Č)
PER(x)
P/BV(x)
RoE(%)
EV/Sales(x)
(Č)
Price ( Č)
( Č cr )
FY17E
FY18E
FY17E
FY18E
FY17E
FY18E
FY17E
FY18E
FY17E
FY18E
FY17E
FY18E
FY17E
FY18E
Agri / Agri Chemical
Rallis
Neutral
241
-
4,679
1,937
2,164
13.3
14.3
9.0
11.0
26.7
21.9
4.7
4.1
18.4
19.8
2.5
2.2
United Phosphorus
Neutral
722
-
36,615
15,176
17,604
18.5
18.5
37.4
44.6
19.3
16.2
3.8
3.1
21.4
21.2
2.5
2.2
Auto & Auto Ancillary
Amara Raja Batteries
Accumulate
877
1,009
14,988
5,305
6,100
16.0
16.3
28.4
34.0
30.9
25.8
6.0
5.0
19.3
19.3
2.8
2.5
Apollo Tyres
Accumulate
209
235
10,646
12,877
14,504
14.3
13.9
21.4
23.0
9.8
9.1
1.5
1.3
16.4
15.2
1.0
0.9
Ashok Leyland
Buy
87
111
24,845
20,021
21,915
11.6
11.9
4.5
5.3
19.4
16.4
4.0
3.5
20.6
21.5
1.2
1.1
Bajaj Auto
Neutral
2,846
-
82,364
25,093
27,891
19.5
19.2
143.9
162.5
19.8
17.5
5.6
4.8
30.3
29.4
3.0
2.7
Bharat Forge
Neutral
1,015
-
23,639
7,726
8,713
20.5
21.2
35.3
42.7
28.8
23.8
5.3
4.8
18.9
20.1
3.1
2.7
Ceat
Accumulate
1,320
1,450
5,340
7,524
8,624
13.0
12.7
131.1
144.3
10.1
9.2
1.9
1.6
19.8
18.6
0.8
0.7
Eicher Motors
Neutral
24,315
-
66,163
16,583
20,447
17.5
18.0
598.0
745.2
40.7
32.6
13.9
10.6
41.2
38.3
3.8
3.0
Exide Industries
Neutral
215
-
18,275
7,439
8,307
15.0
15.0
8.1
9.3
26.5
23.1
3.7
3.3
14.3
16.7
2.1
1.9
Gabriel India
Accumulate
124
130
1,782
1,544
1,715
9.0
9.3
5.4
6.3
23.0
19.7
4.3
3.8
18.9
19.5
1.1
1.0
Hero Motocorp
Neutral
3,377
-
67,430
28,083
30,096
15.3
15.7
171.8
187.0
19.7
18.1
6.9
5.8
30.1
27.9
2.2
2.0
Indag Rubber
Neutral
204
-
535
286
326
19.8
16.8
11.7
13.3
17.4
15.3
2.9
2.8
17.8
17.1
1.5
1.3
Jamna Auto Industries
Neutral
213
-
1,695
1,486
1,620
9.8
9.9
15.0
17.2
14.2
12.4
3.1
2.6
21.8
21.3
1.2
1.1
JK Tyres
Neutral
135
-
3,055
7,455
8,056
15.0
15.0
21.8
24.5
6.2
5.5
1.3
1.1
22.8
21.3
0.5
0.5
L G Balakrishnan & Bros Neutral
614
-
963
1,302
1,432
11.6
11.9
43.7
53.0
14.0
11.6
2.0
1.8
13.8
14.2
0.8
0.7
Mahindra and Mahindra Neutral
1,276
-
79,245
46,534
53,077
11.6
11.7
67.3
78.1
19.0
16.4
3.1
2.7
15.4
15.8
1.7
1.4
Maruti
Accumulate
6,005
6,560
181,386
67,822
83,288
16.0
16.4
253.8
312.4
23.7
19.2
5.4
4.4
23.0
22.9
2.3
1.8
Minda Industries
Neutral
432
-
3,429
2,728
3,042
9.0
9.1
68.2
86.2
6.3
5.0
1.4
1.1
23.8
24.3
1.3
1.2
Motherson Sumi
Neutral
366
-
51,350
45,896
53,687
7.8
8.3
13.0
16.1
28.1
22.7
9.0
7.2
34.7
35.4
1.2
1.0
Rane Brake Lining
Neutral
932
-
738
511
562
11.3
11.5
28.1
30.9
33.2
30.2
5.1
4.6
15.3
15.0
1.6
1.5
Setco Automotive
Neutral
34
-
452
741
837
13.0
13.0
15.2
17.0
2.2
2.0
0.4
0.3
15.8
16.3
1.0
0.9
Subros
Neutral
193
-
1,158
1,488
1,681
11.7
11.9
6.4
7.2
30.2
26.9
3.2
2.9
10.8
11.4
1.0
0.9
Swaraj Engines
Neutral
1,404
-
1,743
660
810
15.2
16.4
54.5
72.8
25.8
19.3
8.0
7.3
31.5
39.2
2.5
2.0
Tata Motors
Neutral
471
-
135,850
300,209
338,549
8.9
8.4
42.7
54.3
11.0
8.7
1.8
1.5
15.6
17.2
0.6
0.5
TVS Motor
Neutral
428
-
20,331
13,390
15,948
6.9
7.1
12.8
16.5
33.5
25.9
8.3
6.6
26.3
27.2
1.6
1.3
Capital Goods
ACE
Neutral
52
-
518
709
814
4.1
4.6
1.4
2.1
37.4
25.0
1.5
1.5
4.4
6.0
0.9
0.8
BEML
Neutral
1,301
-
5,417
3,451
4,055
6.3
9.2
31.4
57.9
41.4
22.5
2.5
2.3
6.3
10.9
1.7
1.4
BGR Energy
Neutral
136
-
984
16,567
33,848
6.0
5.6
7.8
5.9
17.5
23.1
1.0
1.0
4.7
4.2
0.2
0.1
Stock Watch
March 27, 2017
Company Name
Reco
CMP
Target
Mkt Cap
Sales ( Čcr )
OPM(%)
EPS (Č)
PER(x)
P/BV(x)
RoE(%)
EV/Sales(x)
(Č)
Price ( Č)
( Č cr )
FY17E
FY18E
FY17E
FY18E
FY17E
FY18E
FY17E
FY18E
FY17E
FY18E
FY17E
FY18E
FY17E
FY18E
Capital Goods
Bharat Electronics
Neutral
156
-
34,744
8,137
9,169
16.8
17.2
58.7
62.5
2.7
2.5
0.4
0.4
44.6
46.3
3.3
3.0
BHEL
Neutral
167
-
40,924
28,797
34,742
-
2.8
2.3
6.9
72.7
24.2
1.2
1.2
1.3
4.8
1.1
0.8
Blue Star
Accumulate
610
634
5,831
4,283
5,077
5.9
7.3
14.9
22.1
41.0
27.6
8.0
6.7
20.4
26.4
1.4
1.2
CG Power and Industrial
Neutral
77
-
4,845
5,777
6,120
5.9
7.0
3.3
4.5
23.4
17.2
1.0
1.0
4.4
5.9
0.8
0.6
Solutions
Greaves Cotton
Neutral
159
-
3,888
1,755
1,881
16.8
16.9
7.8
8.5
20.4
18.7
4.1
3.8
20.6
20.9
1.9
1.8
Inox Wind
Neutral
173
-
3,847
5,605
6,267
15.7
16.4
24.8
30.0
7.0
5.8
2.0
1.4
25.9
24.4
0.7
0.6
KEC International
Neutral
209
-
5,360
9,294
10,186
7.9
8.1
9.9
11.9
21.1
17.5
3.1
2.7
15.6
16.3
0.8
0.7
KEI Industries
Buy
175
207
1,361
2,682
3,058
10.4
10.0
11.7
12.8
14.9
13.7
3.0
2.5
20.1
18.2
0.7
0.6
Thermax
Neutral
909
-
10,834
5,421
5,940
7.3
7.3
25.7
30.2
35.4
30.1
4.3
3.9
12.2
13.1
1.9
1.7
VATech Wabag
Accumulate
669
681
3,652
3,136
3,845
8.9
9.1
26.0
35.9
25.7
18.6
3.2
2.7
13.4
15.9
1.0
0.8
Voltas
Accumulate
389
407
12,861
6,511
7,514
7.9
8.7
12.9
16.3
30.1
23.9
5.4
4.8
16.7
18.5
1.7
1.5
Cement
ACC
Neutral
1,395
-
26,196
11,225
13,172
13.2
16.9
44.5
75.5
31.4
18.5
3.0
2.7
11.2
14.2
2.3
2.0
Ambuja Cements
Neutral
230
-
45,739
9,350
10,979
18.2
22.5
5.8
9.5
39.7
24.3
3.3
3.0
10.2
12.5
5.0
4.2
India Cements
Neutral
158
-
4,853
4,364
4,997
18.5
19.2
7.9
11.3
20.0
14.0
1.4
1.4
8.0
8.5
1.9
1.6
J K Lakshmi Cement
Neutral
433
-
5,091
2,913
3,412
14.5
19.5
7.5
22.5
57.7
19.2
3.6
3.0
12.5
18.0
2.4
2.0
JK Cement
Neutral
884
-
6,178
4,398
5,173
15.5
17.5
31.2
55.5
28.3
15.9
3.4
3.0
12.0
15.5
2.0
1.6
Orient Cement
Neutral
128
-
2,626
2,114
2,558
18.5
20.5
8.1
11.3
15.8
11.4
2.3
2.0
9.0
14.0
1.9
1.4
UltraTech Cement
Neutral
3,972
-
109,029
25,768
30,385
21.0
23.5
111.0
160.0
35.8
24.8
4.6
4.0
13.5
15.8
4.3
3.6
Construction
Engineers India
Neutral
148
-
9,946
1,725
1,935
16.0
19.1
11.4
13.9
13.0
10.6
1.8
1.7
13.4
15.3
4.7
4.2
Gujarat Pipavav Port
Neutral
169
-
8,158
705
788
52.2
51.7
5.0
5.6
33.8
30.1
3.3
3.0
11.2
11.2
11.0
9.4
ITNL
Neutral
106
-
3,477
8,946
10,017
31.0
31.6
8.1
9.1
13.1
11.6
0.5
0.5
4.2
5.0
3.7
3.5
KNR Constructions
Neutral
181
-
2,551
1,385
1,673
14.7
14.0
41.2
48.5
4.4
3.7
0.8
0.7
14.9
15.2
1.9
1.6
Larsen & Toubro
Accumulate
1,551
1,700
144,736
111,017
124,908
11.0
11.0
61.1
66.7
25.4
23.3
3.1
2.8
13.1
12.9
2.3
2.2
MEP Infra
Neutral
51
-
828
1,877
1,943
30.6
29.8
3.0
4.2
17.0
12.1
8.2
5.5
0.6
0.6
1.8
1.7
Nagarjuna Const.
Neutral
82
-
4,567
8,842
9,775
9.1
8.8
5.3
6.4
15.5
12.8
1.2
1.1
8.2
9.1
0.7
0.6
NBCC
Neutral
175
-
15,759
7,428
9,549
7.9
8.6
8.2
11.0
21.4
15.9
1.1
0.8
28.2
28.7
1.8
1.4
PNC Infratech
Buy
115
143
2,957
2,350
2,904
13.1
13.2
9.0
8.8
12.8
13.1
0.5
0.4
15.9
13.9
1.4
1.1
Power Mech Projects
Neutral
512
-
753
1,801
2,219
12.7
14.6
72.1
113.9
7.1
4.5
1.3
1.1
16.8
11.9
0.4
0.3
Sadbhav Engineering
Neutral
309
-
5,296
3,598
4,140
10.3
10.6
9.0
11.9
34.3
25.9
3.6
3.2
9.9
11.9
1.8
1.5
Stock Watch
March 27, 2017
Company Name
Reco
CMP
Target
Mkt Cap
Sales ( Čcr )
OPM(%)
EPS (Č)
PER(x)
P/BV(x)
RoE(%)
EV/Sales(x)
(Č)
Price ( Č)
( Č cr )
FY17E
FY18E
FY17E
FY18E
FY17E
FY18E
FY17E
FY18E
FY17E
FY18E
FY17E
FY18E
FY17E
FY18E
Construction
Simplex Infra
Neutral
312
-
1,542
6,829
7,954
10.5
10.5
31.4
37.4
9.9
8.3
1.0
0.9
9.9
13.4
0.6
0.5
SIPL
Neutral
101
-
3,557
1,036
1,252
65.5
66.2
(8.4)
(5.6)
3.8
4.3
(22.8)
(15.9)
11.7
9.8
Financials
Axis Bank
Buy
489
580
117,107
46,932
53,575
3.5
3.4
32.4
44.6
15.1
11.0
1.9
1.7
13.6
16.5
-
-
Bank of Baroda
Neutral
169
-
38,952
19,980
23,178
1.8
1.8
11.5
17.3
14.7
9.8
1.7
1.4
8.3
10.1
-
-
Can Fin Homes
Neutral
2,080
-
5,537
420
526
3.5
3.5
86.5
107.8
24.1
19.3
5.2
4.2
23.6
24.1
-
-
Canara Bank
Neutral
293
-
15,934
15,225
16,836
1.8
1.8
14.5
28.0
20.2
10.5
1.4
1.1
5.8
8.5
-
-
Cholamandalam Inv. &
Buy
994
1,230
15,532
2,012
2,317
6.3
6.3
42.7
53.6
23.3
18.5
3.7
3.2
16.9
18.3
-
-
Fin. Co.
Dewan Housing Finance Neutral
362
-
11,328
2,225
2,688
2.9
2.9
29.7
34.6
12.2
10.5
2.0
1.7
16.1
16.8
-
-
Equitas Holdings
Buy
158
235
5,346
939
1,281
11.7
11.5
5.8
8.2
27.3
19.3
2.4
2.1
10.9
11.5
-
-
Federal Bank
Neutral
90
-
15,446
8,259
8,995
3.0
3.0
4.3
5.6
20.9
16.0
1.8
1.6
8.5
10.1
-
-
HDFC
Neutral
1,462
-
232,217
11,475
13,450
3.4
3.4
45.3
52.5
32.3
27.9
6.2
5.5
20.2
20.5
-
-
HDFC Bank
Neutral
1,425
-
364,773
46,097
55,433
4.5
4.5
58.4
68.0
24.4
21.0
4.3
3.6
18.8
18.6
-
-
ICICI Bank
Buy
275
315
160,026
42,800
44,686
3.1
3.3
18.0
21.9
15.3
12.6
2.1
1.9
11.1
12.3
-
-
Lakshmi Vilas Bank
Accumulate
165
174
3,149
3,339
3,799
2.7
2.8
11.0
14.0
15.0
11.8
1.6
1.4
11.2
12.7
-
-
LIC Housing Finance
Accumulate
600
630
30,260
3,712
4,293
2.6
2.5
39.0
46.0
15.4
13.0
2.9
2.5
19.9
20.1
-
-
Punjab Natl.Bank
Neutral
141
-
30,068
23,532
23,595
2.3
2.4
6.8
12.6
20.8
11.2
3.2
2.3
3.3
6.5
-
-
RBL Bank
Neutral
493
-
18,230
1,783
2,309
2.6
2.6
12.7
16.4
38.8
30.1
4.2
3.8
12.8
13.3
-
-
Repco Home Finance
Buy
679
825
4,247
388
457
4.5
4.2
30.0
38.0
22.6
17.9
3.8
3.2
18.0
19.2
-
-
South Ind.Bank
Neutral
20
-
2,752
6,435
7,578
2.5
2.5
2.7
3.1
7.5
6.6
1.0
0.8
10.1
11.2
-
-
St Bk of India
Neutral
276
-
220,109
88,650
98,335
2.6
2.6
13.5
18.8
20.5
14.7
1.9
1.7
7.0
8.5
-
-
Union Bank
Neutral
154
-
10,576
13,450
14,925
2.3
2.3
25.5
34.5
6.0
4.5
0.9
0.8
7.5
10.2
-
-
Yes Bank
Neutral
1,529
-
64,771
8,978
11,281
3.3
3.4
74.0
90.0
20.7
17.0
3.9
3.3
17.0
17.2
-
-
FMCG
Akzo Nobel India
Neutral
1,764
-
8,459
2,955
3,309
13.3
13.7
57.2
69.3
30.9
25.5
10.1
8.5
32.7
33.3
2.6
2.3
Asian Paints
Neutral
1,066
-
102,250
17,128
18,978
16.8
16.4
19.1
20.7
55.8
51.5
19.4
18.3
34.8
35.5
5.9
5.3
Britannia
Accumulate
3,300
3,626
39,596
9,594
11,011
14.6
14.9
80.3
94.0
41.1
35.1
16.9
13.1
41.2
-
4.0
3.4
Colgate
Neutral
980
-
26,641
4,605
5,149
23.4
23.4
23.8
26.9
41.2
36.4
22.8
17.8
64.8
66.8
5.7
5.1
Dabur India
Accumulate
281
304
49,578
8,315
9,405
19.8
20.7
8.1
9.2
34.8
30.6
9.7
8.0
31.6
31.0
5.6
4.9
GlaxoSmith Con*
Neutral
5,206
-
21,895
4,350
4,823
21.2
21.4
179.2
196.5
29.1
26.5
7.7
6.5
27.1
26.8
4.5
4.0
Godrej Consumer
Neutral
1,665
-
56,720
10,235
11,428
18.4
18.6
41.1
44.2
40.5
37.7
9.0
7.6
24.9
24.8
5.7
5.1
Stock Watch
March 27, 2017
Company Name
Reco
CMP
Target
Mkt Cap
Sales ( Čcr )
OPM(%)
EPS (Č)
PER(x)
P/BV(x)
RoE(%)
EV/Sales(x)
(Č)
Price ( Č)
( Č cr )
FY17E FY18E
FY17E
FY18E
FY17E
FY18E
FY17E
FY18E
FY17E
FY18E
FY17E
FY18E
FY17E
FY18E
FMCG
HUL
Neutral
900
-
194,722
35,252
38,495
17.8
17.8
20.7
22.4
43.6
40.2
41.6
35.7
95.6
88.9
5.4
4.9
ITC
Neutral
281
-
341,195
40,059
44,439
38.3
39.2
9.0
10.1
31.3
27.7
8.7
7.6
27.8
27.5
7.9
7.1
Marico
Neutral
291
-
37,576
6,430
7,349
18.8
19.5
6.4
7.7
45.5
37.8
13.7
11.6
33.2
32.5
5.7
4.9
Nestle*
Neutral
6,338
-
61,111
10,073
11,807
20.7
21.5
124.8
154.2
50.8
41.1
20.9
18.8
34.8
36.7
5.9
5.0
Procter & Gamble
Accumulate
7,078
7,369
22,976
2,939
3,342
23.2
23.0
146.2
163.7
48.4
43.2
12.3
10.2
25.3
23.5
7.2
6.3
Hygiene
Tata Global
Neutral
151
-
9,540
8,675
9,088
9.8
9.8
7.4
8.2
20.4
18.4
1.6
1.5
7.9
8.1
1.0
1.0
IT
HCL Tech^
Accumulate
871
1,000
122,974
49,242
57,168
20.5
20.5
55.7
64.1
15.6
13.6
3.2
2.4
20.3
17.9
2.4
1.9
Infosys
Buy
1,032
1,249
236,999
68,350
77,326
27.0
27.0
62.5
69.4
16.5
14.9
3.5
3.2
21.3
21.6
2.9
2.5
TCS
Accumulate
2,427
2,700
478,174
119,025
133,308
27.6
27.6
131.2
145.5
18.5
16.7
6.0
5.5
32.4
33.1
3.8
3.4
Tech Mahindra
Buy
474
600
46,178
29,673
32,937
15.5
17.0
32.8
39.9
14.5
11.9
2.8
2.5
19.6
20.7
1.3
1.1
Wipro
Accumulate
513
583
124,583
55,440
60,430
18.1
18.1
36.1
38.9
14.2
13.2
2.6
2.4
19.0
17.6
2.0
1.7
Media
D B Corp
Neutral
379
-
6,971
2,297
2,590
27.4
28.2
21.0
23.4
18.1
16.2
4.2
3.7
23.7
23.1
2.8
2.5
Hindustan Media
Neutral
285
-
2,089
1,016
1,138
24.3
25.2
27.3
30.1
10.4
9.5
2.0
1.8
16.2
15.8
1.4
1.2
Ventures
HT Media
Neutral
82
-
1,897
2,693
2,991
12.6
12.9
7.9
9.0
10.3
9.1
0.9
0.8
7.8
8.3
0.3
0.2
Jagran Prakashan
Buy
175
225
5,714
2,355
2,635
28.0
28.0
10.8
12.5
16.2
14.0
3.5
3.0
21.7
21.7
2.4
2.1
Sun TV Network
Neutral
755
-
29,744
2,850
3,265
70.1
71.0
26.2
30.4
28.8
24.8
7.4
6.5
24.3
25.6
10.0
8.6
TV Today Network
Buy
269
344
1,604
567
645
26.7
27.0
15.4
18.1
17.5
14.9
2.6
2.3
14.9
15.2
2.4
2.0
Metals & Mining
Coal India
Neutral
298
-
185,012
84,638
94,297
21.4
22.3
24.5
27.1
12.2
11.0
5.1
4.8
42.6
46.0
1.7
1.5
Hind. Zinc
Neutral
323
-
136,414
14,252
18,465
55.9
48.3
15.8
21.5
20.4
15.0
3.3
2.9
17.0
20.7
9.5
7.3
Hindalco
Neutral
194
-
40,160
107,899
112,095
7.4
8.2
9.2
13.0
21.1
15.0
1.0
1.0
4.8
6.6
0.9
0.8
JSW Steel
Neutral
187
-
45,166
53,201
58,779
16.1
16.2
130.6
153.7
1.4
1.2
0.2
0.2
14.0
14.4
1.6
1.4
NMDC
Neutral
137
-
43,345
6,643
7,284
44.4
47.7
7.1
7.7
19.3
17.8
1.7
1.6
8.8
9.2
4.2
3.8
SAIL
Neutral
62
-
25,751
47,528
53,738
(0.7)
2.1
(1.9)
2.6
24.0
0.7
0.7
(1.6)
3.9
1.4
1.3
Tata Steel
Neutral
493
-
47,900
121,374
121,856
7.2
8.4
18.6
34.3
26.5
14.4
1.7
1.5
6.1
10.1
1.0
1.0
Vedanta
Neutral
267
-
79,172
71,744
81,944
19.2
21.7
13.4
20.1
19.9
13.3
1.7
1.5
8.4
11.3
1.5
1.2
Oil & Gas
Cairn India
Neutral
296
-
55,545
9,127
10,632
4.3
20.6
8.8
11.7
33.7
25.3
1.1
1.1
3.3
4.2
7.6
6.4
GAIL
Neutral
381
-
64,481
56,220
65,198
9.3
10.1
27.1
33.3
14.1
11.5
1.3
1.2
9.3
10.7
1.3
1.1
Indian Oil Corp
Neutral
373
-
180,980
373,359
428,656
5.9
5.5
54.0
59.3
6.9
6.3
1.1
1.0
16.0
15.6
0.6
0.6
ONGC
Neutral
192
-
246,398
137,222
152,563
15.0
21.8
19.5
24.1
9.9
8.0
0.8
0.8
8.5
10.1
2.1
1.9
Stock Watch
March 27, 2017
Company Name
Reco
CMP
Target
Mkt Cap
Sales ( Čcr )
OPM(%)
EPS (Č)
PER(x)
P/BV(x)
RoE(%)
EV/Sales(x)
(Č)
Price ( Č)
( Č cr )
FY17E FY18E
FY17E
FY18E
FY17E
FY18E
FY17E
FY18E
FY17E
FY18E
FY17E
FY18E
FY17E
FY18E
Oil & Gas
Reliance Industries
Neutral
1,286
-
417,241
301,963
358,039
12.1
12.6
87.7
101.7
14.7
12.7
1.5
1.4
10.7
11.3
1.8
1.5
Pharmaceuticals
Alembic Pharma
Buy
602
689
11,351
3,483
4,244
20.2
21.4
24.3
33.6
24.8
17.9
5.6
4.5
25.5
25.3
3.2
2.5
Alkem Laboratories Ltd
Neutral
2,204
-
26,351
6,065
7,009
18.7
20.0
80.2
92.0
27.5
24.0
6.2
5.2
22.5
21.6
4.3
3.7
Aurobindo Pharma
Buy
688
877
40,302
15,720
18,078
23.7
23.7
41.4
47.3
16.6
14.5
4.3
3.4
29.6
26.1
2.8
2.4
Aventis*
Neutral
4,651
-
10,712
2,277
2,597
16.6
17.4
128.9
157.0
36.1
29.6
6.2
4.7
21.6
26.4
4.4
3.7
Cadila Healthcare
Neutral
446
-
45,679
10,429
12,318
17.7
21.6
13.1
19.2
34.1
23.2
7.1
5.7
22.8
27.1
4.4
3.6
Cipla
Sell
593
465
47,725
15,378
18,089
15.7
16.8
19.3
24.5
30.7
24.2
3.6
3.2
12.3
13.9
3.3
2.8
Dishman Pharma
Sell
234
143
3,782
1,718
1,890
22.7
22.8
9.5
11.3
24.7
20.7
2.4
2.2
10.1
10.9
2.7
2.4
Dr Reddy's
Neutral
2,623
-
43,458
16,043
18,119
18.0
23.0
78.6
130.9
33.4
20.0
3.3
2.9
10.1
15.2
2.5
2.4
GSK Pharma*
Neutral
2,754
-
23,330
2,800
3,290
10.2
20.6
32.2
60.3
85.5
45.7
15.8
15.7
17.2
34.5
8.1
6.9
Indoco Remedies
Reduce
255
240
2,348
1,112
1,289
16.2
18.2
11.6
16.0
22.0
15.9
3.5
3.0
17.0
20.1
2.3
1.9
Ipca labs
Accumulate
587
613
7,405
3,258
3,747
12.8
15.3
12.1
19.2
48.5
30.6
3.0
2.8
6.4
9.5
2.3
2.0
Lupin
Buy
1,484
1,809
66,984
15,912
18,644
26.4
26.7
58.1
69.3
25.5
21.4
5.0
4.1
21.4
20.9
4.3
3.5
Sun Pharma
Buy
703
847
168,738
31,129
35,258
32.0
32.9
30.2
35.3
23.3
19.9
3.8
3.1
20.0
20.1
5.0
4.2
Power
NTPC
Neutral
164
-
135,349
86,605
95,545
17.5
20.8
11.8
13.4
13.9
12.3
1.4
1.3
10.5
11.1
2.9
2.9
Power Grid
Buy
194
223
101,336
25,315
29,193
88.2
88.7
14.2
17.2
13.7
11.3
2.1
1.8
15.2
16.1
8.6
7.8
Tata Power
Neutral
87
-
23,410
36,916
39,557
17.4
27.1
5.1
6.3
17.0
13.7
1.5
1.4
9.0
10.3
1.7
1.5
Real Estate
MLIFE
Buy
410
522
1,681
1,152
1,300
22.7
24.6
29.9
35.8
13.7
11.4
1.0
1.0
7.6
8.6
2.2
1.8
Prestige Estate
Accumulate
202
210
7,562
4,707
5,105
25.2
26.0
10.3
13.0
19.6
15.5
1.6
1.5
10.3
10.2
2.8
2.4
Telecom
Bharti Airtel
Neutral
340
-
136,072
105,086
114,808
34.5
34.7
12.2
16.4
27.9
20.8
1.9
1.8
6.8
8.4
2.2
1.9
Idea Cellular
Neutral
91
-
32,738
40,133
43,731
37.2
37.1
6.4
6.5
14.2
14.0
1.2
1.1
8.2
7.6
1.8
1.6
zOthers
Abbott India
Neutral
4,674
-
9,933
3,153
3,583
14.1
14.4
152.2
182.7
30.7
25.6
150.8
128.8
25.6
26.1
2.9
2.5
Asian Granito
Neutral
357
-
1,073
1,060
1,169
12.2
12.5
12.7
15.9
28.2
22.5
2.7
2.4
9.5
10.7
1.3
1.1
Bajaj Electricals
Neutral
316
-
3,198
4,801
5,351
5.7
6.2
10.4
13.7
30.3
23.1
3.7
3.3
12.4
14.5
0.7
0.6
Banco Products (India)
Neutral
213
-
1,523
1,353
1,471
12.3
12.4
14.5
16.3
14.7
13.1
20.3
18.3
14.5
14.6
1.0
109.8
Coffee Day Enterprises
Neutral
237
-
4,877
2,964
3,260
20.5
21.2
4.7
8.0
-
29.6
2.7
2.5
5.5
8.5
2.1
1.9
Ltd
Competent Automobiles Neutral
175
-
108
1,137
1,256
3.1
2.7
28.0
23.6
6.3
7.4
33.7
30.5
14.3
11.5
0.1
0.1
Elecon Engineering
Neutral
52
-
586
1,482
1,660
13.7
14.5
3.9
5.8
13.4
9.0
3.2
2.9
7.8
10.9
0.7
0.6
Finolex Cables
Neutral
466
-
7,124
2,883
3,115
12.0
12.1
14.2
18.6
32.8
25.0
17.5
15.3
15.8
14.6
2.2
1.9
Stock Watch
March 27, 2017
Company Name
Reco
CMP
Target
Mkt Cap
Sales ( Čcr )
OPM(%)
EPS (Č)
PER(x)
P/BV(x)
RoE(%)
EV/Sales(x)
(Č)
Price ( Č)
( Č cr )
FY17E
FY18E
FY17E
FY18E
FY17E
FY18E
FY17E
FY18E
FY17E
FY18E
FY17E
FY18E
FY17E
FY18E
zOthers
Garware Wall Ropes
Neutral
701
-
1,533
863
928
15.1
15.2
36.4
39.4
19.3
17.8
3.5
3.0
17.5
15.9
1.7
1.5
Goodyear India*
Neutral
805
-
1,856
1,598
1,704
10.4
10.2
49.4
52.6
16.3
15.3
75.2
66.0
18.2
17.0
0.8
117.1
Hitachi
Neutral
1,579
-
4,293
2,081
2,433
8.8
8.9
33.4
39.9
47.3
39.6
38.1
31.8
22.1
21.4
2.1
1.7
HSIL
Neutral
329
-
2,376
2,384
2,515
15.8
16.3
15.3
19.4
21.5
16.9
21.3
18.4
7.8
9.3
1.2
1.1
Interglobe Aviation
Neutral
1,021
-
36,901
21,122
26,005
14.5
27.6
110.7
132.1
9.2
7.7
55.2
39.4
168.5
201.1
1.7
1.3
Jyothy Laboratories
Neutral
353
-
6,417
1,440
2,052
11.5
13.0
8.5
10.0
41.6
35.3
10.1
9.3
18.6
19.3
4.7
3.3
Kirloskar Engines India
Neutral
390
-
5,640
2,554
2,800
9.9
10.0
10.5
12.1
37.1
32.2
15.5
14.7
10.7
11.7
1.8
1.6
Ltd
Linc Pen & Plastics
Neutral
263
-
389
382
420
9.3
9.5
13.5
15.7
19.5
16.7
3.3
2.9
17.1
17.3
1.0
0.9
M M Forgings
Neutral
547
-
661
546
608
20.4
20.7
41.3
48.7
13.3
11.2
75.0
66.4
16.6
17.0
1.0
0.9
Manpasand Bever.
Neutral
715
-
4,091
836
1,087
19.6
19.4
16.9
23.8
42.3
30.0
5.1
4.4
12.0
14.8
4.7
3.5
Mirza International
Buy
84
107
1,012
963
1,069
17.2
18.0
6.1
7.5
13.7
11.2
2.1
1.8
15.0
15.7
1.3
1.2
MT Educare
Neutral
79
-
316
366
417
17.7
18.2
9.4
10.8
8.5
7.4
1.9
1.6
22.2
22.3
0.8
0.7
Narayana Hrudaya
Neutral
321
-
6,552
1,873
2,166
11.5
11.7
2.6
4.0
121.2
80.9
7.4
6.7
6.1
8.3
3.6
3.1
Navkar Corporation
Buy
173
265
2,469
369
561
42.9
42.3
6.9
11.5
25.1
15.0
1.8
1.6
7.4
10.5
7.6
5.0
Navneet Education
Neutral
139
-
3,248
1,062
1,147
24.0
24.0
6.1
6.6
22.8
21.0
4.7
4.2
20.6
19.8
3.2
2.9
Nilkamal
Neutral
1,856
-
2,769
1,995
2,165
10.7
10.4
69.8
80.6
26.6
23.0
106.1
92.1
16.6
16.5
1.4
1.2
Page Industries
Neutral
14,652
-
16,343
2,450
3,124
20.1
17.6
299.0
310.0
49.0
47.3
326.3
249.1
47.1
87.5
6.8
5.3
Parag Milk Foods
Neutral
225
-
1,888
1,919
2,231
9.3
9.6
9.5
12.9
23.8
17.4
3.7
3.0
15.5
17.5
1.1
1.0
Quick Heal
Neutral
238
-
1,672
408
495
27.3
27.0
7.7
8.8
30.8
27.1
2.9
2.9
9.3
10.6
3.2
2.7
Radico Khaitan
Buy
125
147
1,658
1,667
1,824
13.0
13.2
6.7
8.2
18.7
15.2
1.7
1.6
9.0
10.2
1.4
1.2
Relaxo Footwears
Neutral
469
-
5,630
2,085
2,469
9.2
8.2
7.6
8.0
62.0
59.0
24.0
20.5
17.9
18.8
2.8
2.4
S H Kelkar & Co.
Neutral
306
-
4,424
1,036
1,160
15.1
15.0
6.1
7.2
50.1
42.6
5.4
4.9
10.7
11.5
4.2
3.7
Siyaram Silk Mills
Accumulate
1,681
1,872
1,576
1,652
1,857
11.6
11.7
92.4
110.1
18.2
15.3
2.7
2.3
14.7
15.2
1.2
1.1
Styrolution ABS India*
Neutral
640
-
1,125
1,440
1,537
9.2
9.0
40.6
42.6
15.8
15.0
40.3
36.6
12.3
11.6
0.7
0.6
Surya Roshni
Neutral
197
-
865
3,342
3,625
7.8
7.5
17.3
19.8
11.4
10.0
21.7
17.4
10.5
10.8
0.5
0.5
Team Lease Serv.
Neutral
955
-
1,632
3,229
4,001
1.5
1.8
22.8
32.8
41.9
29.1
4.5
3.9
10.7
13.4
0.4
0.3
The Byke Hospitality
Neutral
183
-
735
287
384
20.5
20.5
7.6
10.7
24.1
17.1
5.0
4.1
20.7
23.5
2.6
1.9
Transport Corporation of
Neutral
219
-
1,673
2,671
2,911
8.5
8.8
13.9
15.7
15.8
14.0
2.2
1.9
13.7
13.8
0.7
0.7
India
TVS Srichakra
Neutral
3,794
-
2,905
2,304
2,614
13.7
13.8
231.1
266.6
16.4
14.2
426.3
335.7
33.9
29.3
1.3
1.1
Stock Watch
March 27, 2017
Company Name
Reco
CMP
Target Mkt Cap
Sales ( Čcr )
OPM(%)
EPS (Č)
PER(x)
P/BV(x)
RoE(%)
EV/Sales(x)
(Č)
Price ( Č)
( Č cr )
FY17E FY18E FY17E FY18E FY17E FY18E FY17E FY18E FY17E FY18E FY17E FY18E FY17E FY18E
zOthers
UFO Moviez
Neutral
420
-
1,159
619
685
33.2
33.4
30.0
34.9
14.0
12.0
1.9
1.7
13.8
13.9
1.6
1.3
Visaka Industries
Neutral
259
-
411
1,051
1,138
10.3
10.4
21.0
23.1
12.3
11.2
33.2
31.1
9.0
9.2
0.7
0.6
VRL Logistics
Neutral
299
-
2,724
1,902
2,119
16.7
16.6
14.6
16.8
20.5
17.7
4.5
3.9
21.9
22.2
1.5
1.4
Wonderla Holidays
Neutral
382
-
2,158
287
355
38.0
40.0
11.3
14.2
33.8
26.9
4.8
4.2
21.4
23.9
7.1
5.8
VIP Industries
Accumulate
174
180
2,458
1,270
1,450
10.4
10.4
5.6
6.5
31.1
26.8
6.4
5.6
20.7
21.1
1.9
1.6
Source: Company, Angel Research; Note: *December year end; #September year end; &October year end; Price as on March 24, 2017
Market Outlook
March 27, 2017
Research Team Tel: 022 - 39357800
DISCLAIMER
Angel Broking Private Limited (hereinafter referred to as “Angel”) is a registered Member of National Stock Exchange of India
Limited,Bombay Stock Exchange Limited and Metropolitan Stock Exchange Limited. It is also registered as a Depository Participant with
CDSL and Portfolio Manager with SEBI. It also has registration with AMFI as a Mutual Fund Distributor. Angel Broking Private Limited is a
registered entity with SEBI for Research Analyst in terms of SEBI (Research Analyst) Regulations, 2014 vide registration number
INH000000164. Angel or its associates has not been debarred/ suspended by SEBI or any other regulatory authority for accessing
/dealing in securities Market. Angel or its associates/analyst has not received any compensation / managed or
co-managed public offering of securities of the company covered by Analyst during the past twelve months.
This document is solely for the personal information of the recipient, and must not be singularly used as the basis of any investment
decision. Nothing in this document should be construed as investment or financial advice. Each recipient of this document should make
such investigations as they deem necessary to arrive at an independent evaluation of an investment in the securities of the companies
referred to in this document (including the merits and risks involved), and should consult their own advisors to determine the merits and
risks of such an investment.
Reports based on technical and derivative analysis center on studying charts of a stock's price movement, outstanding positions and
trading volume, as opposed to focusing on a company's fundamentals and, as such, may not match with a report on a company's
fundamentals. Investors are advised to refer the Fundamental and Technical Research Reports available on our website to evaluate the
contrary view, if any.
The information in this document has been printed on the basis of publicly available information, internal data and other reliable
sources believed to be true, but we do not represent that it is accurate or complete and it should not be relied on as such, as this
document is for general guidance only. Angel Broking Pvt. Limited or any of its affiliates/ group companies shall not be in any way
responsible for any loss or damage that may arise to any person from any inadvertent error in the information contained in this report.
Angel Broking Pvt. Limited has not independently verified all the information contained within this document. Accordingly, we cannot
testify, nor make any representation or warranty, express or implied, to the accuracy, contents or data contained within this document.
While Angel Broking Pvt. Limited endeavors to update on a reasonable basis the information discussed in this material, there may be
regulatory, compliance, or other reasons that prevent us from doing so.
This document is being supplied to you solely for your information, and its contents, information or data may not be reproduced,
redistributed or passed on, directly or indirectly.
Neither Angel Broking Pvt. Limited, nor its directors, employees or affiliates shall be liable for any loss or damage that may arise from
or in connection with the use of this information.